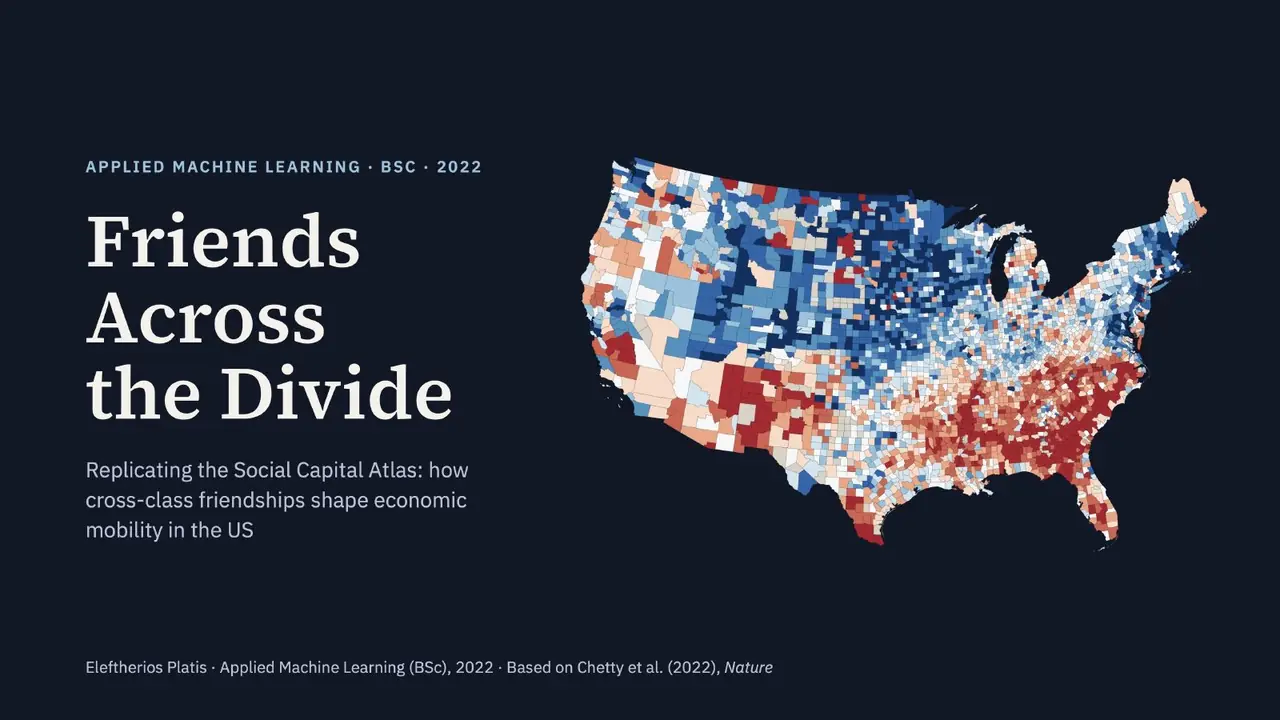
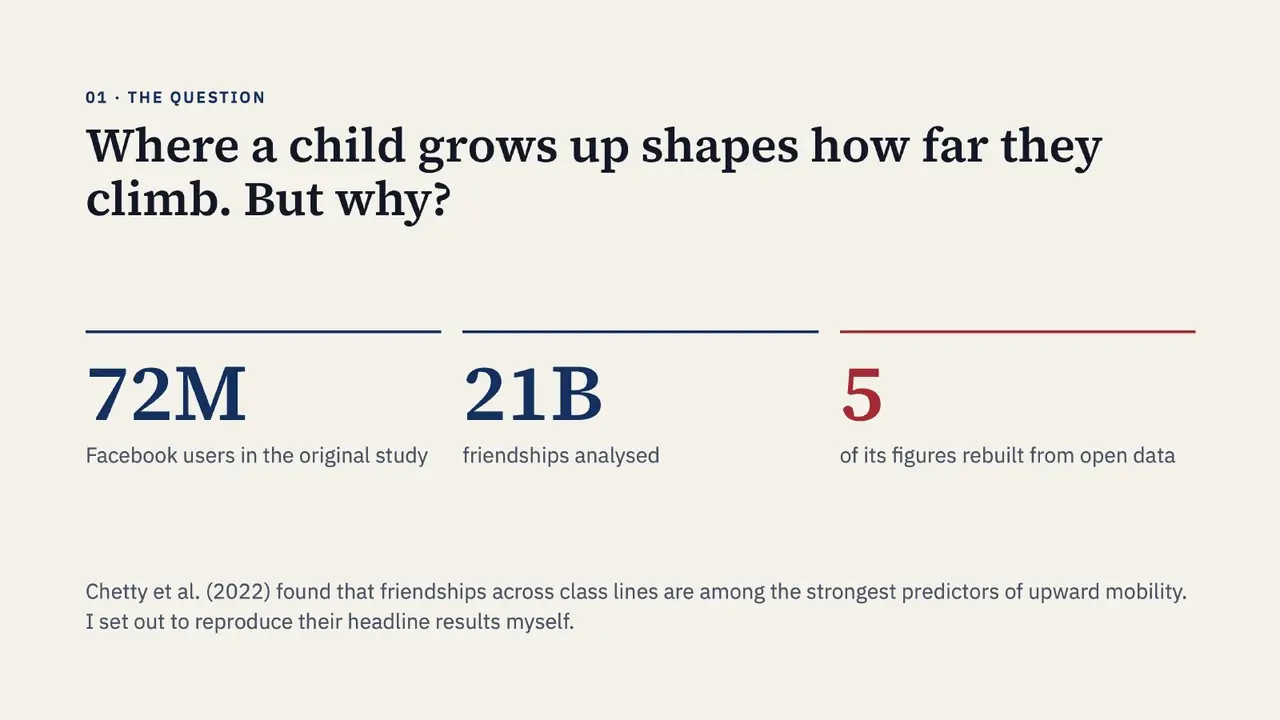
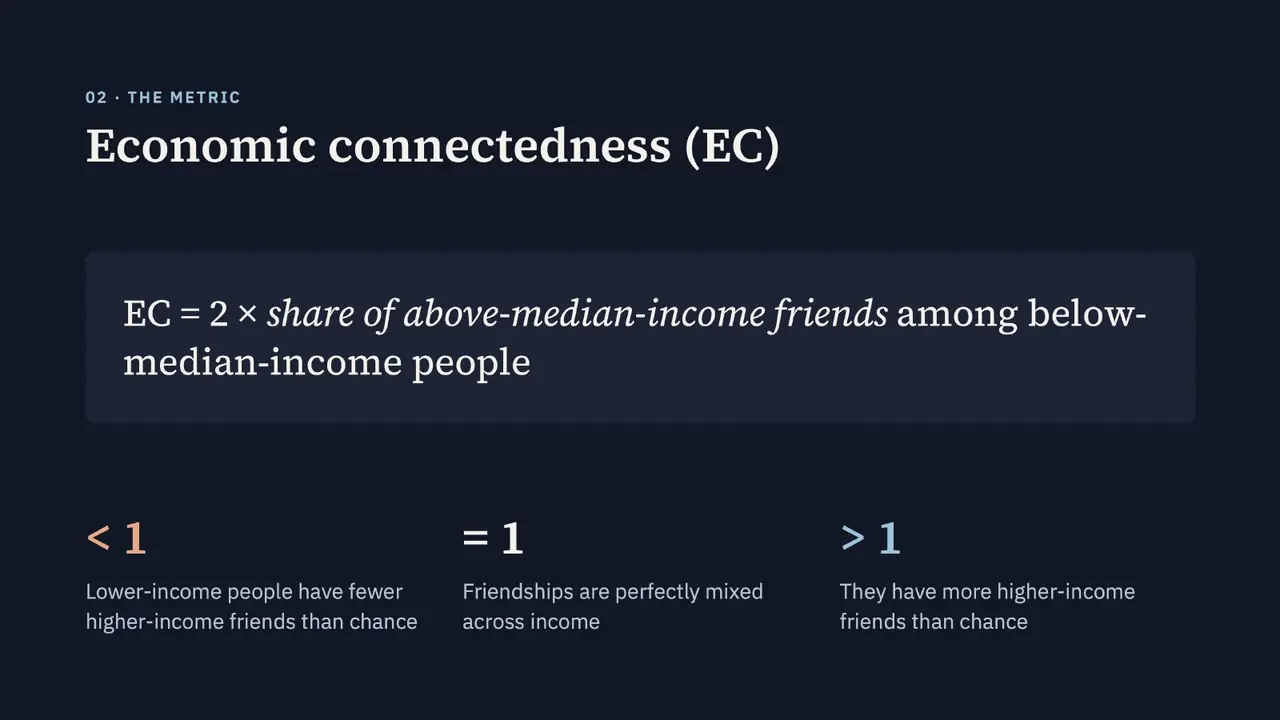
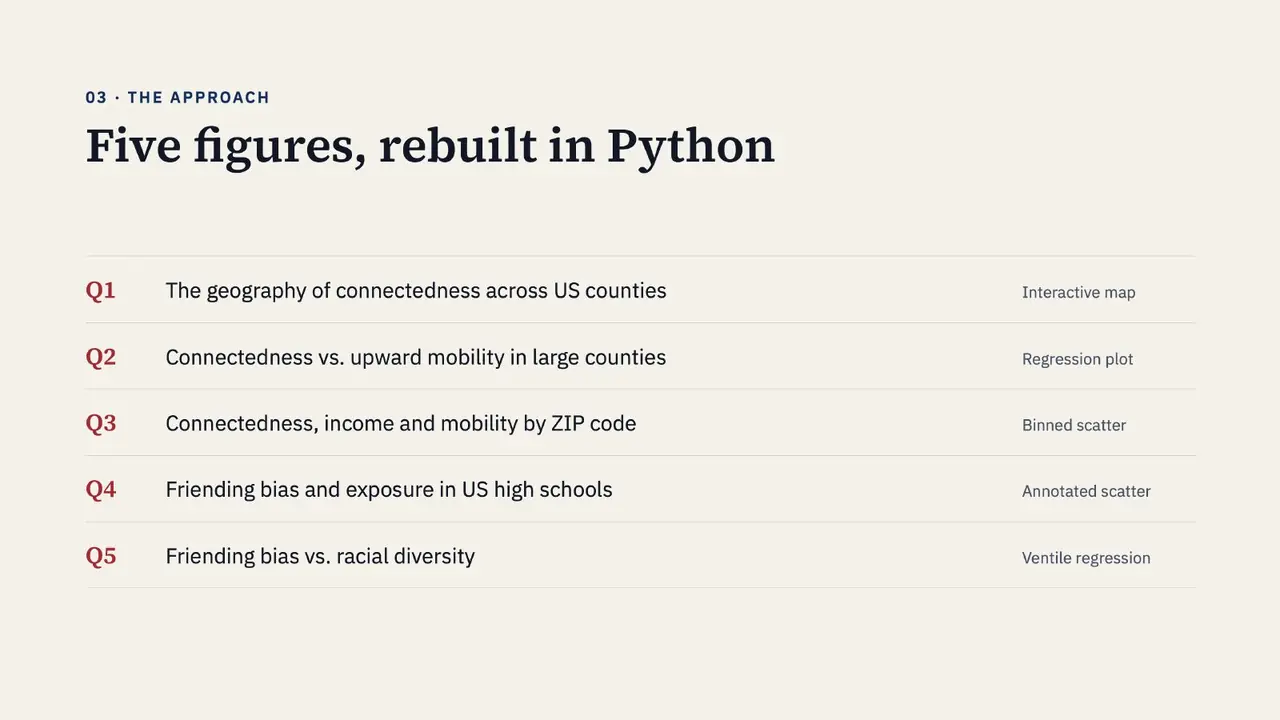
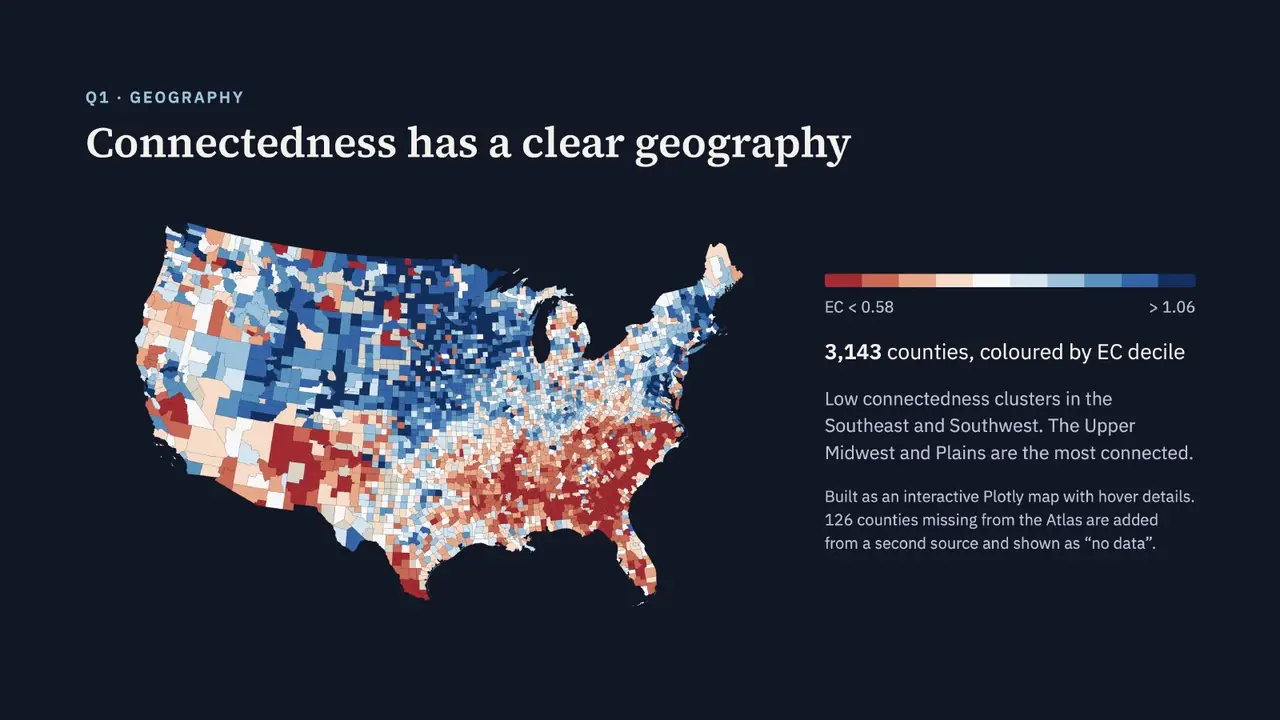
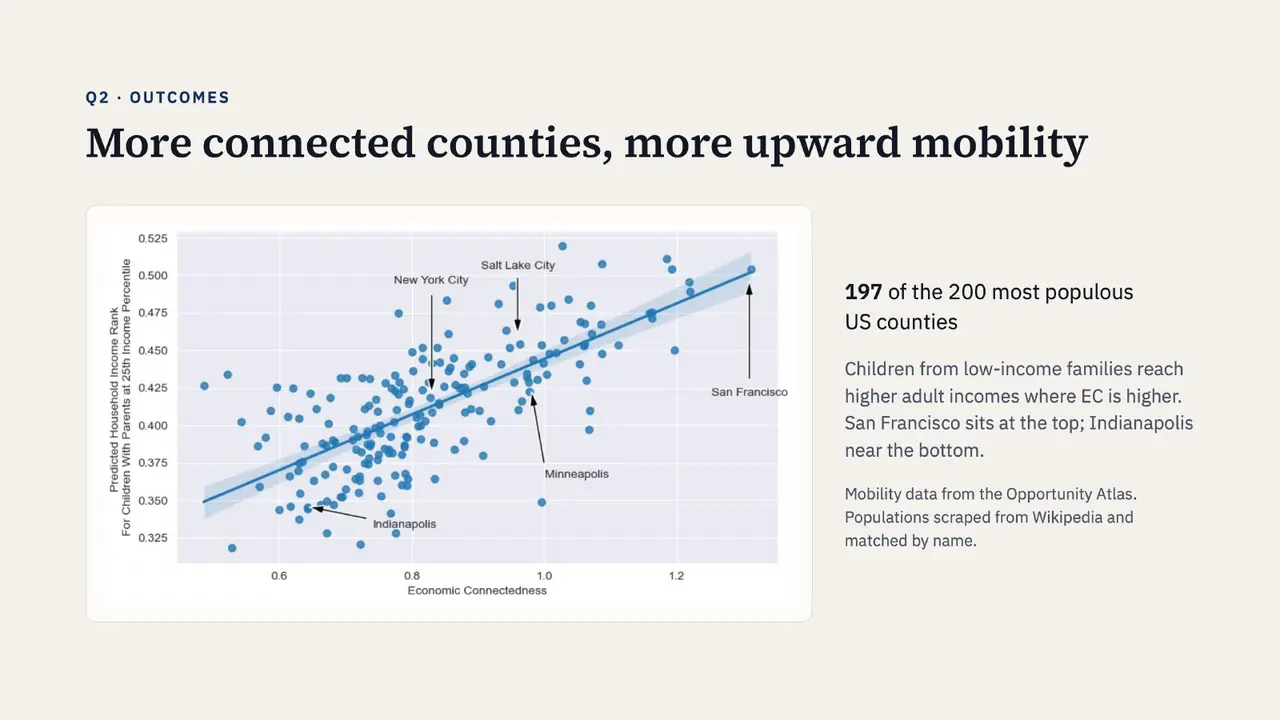
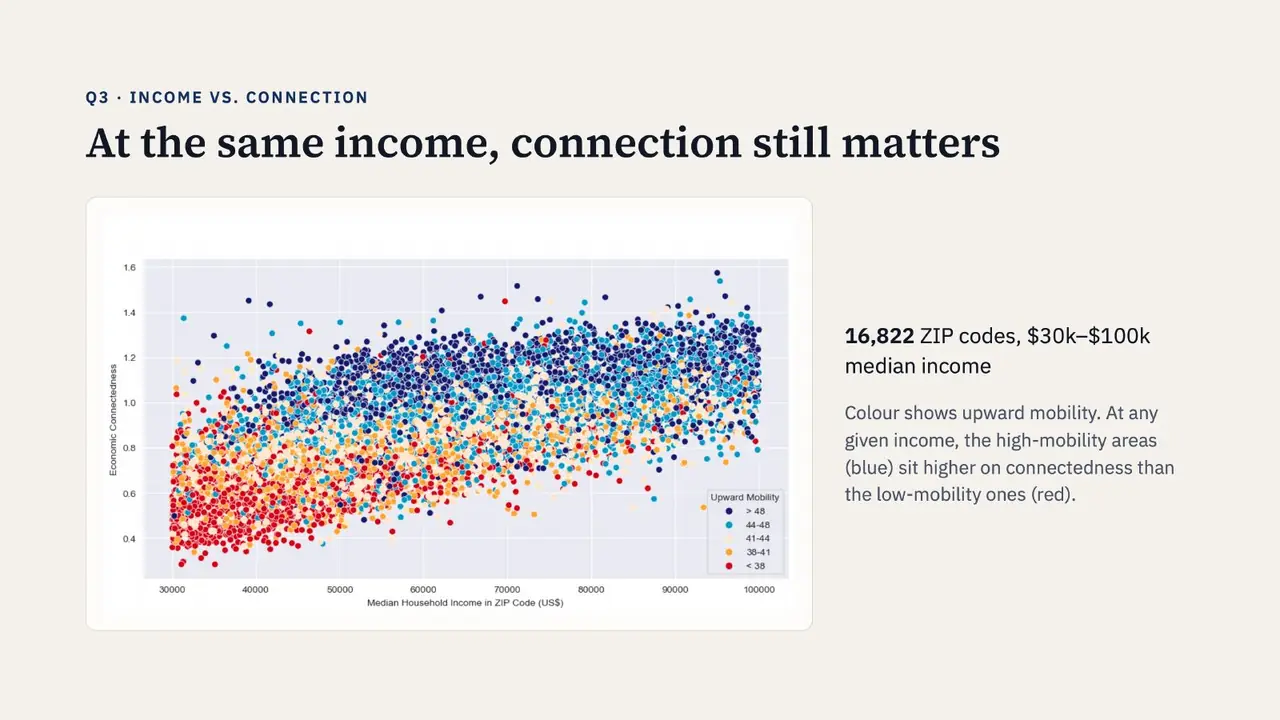
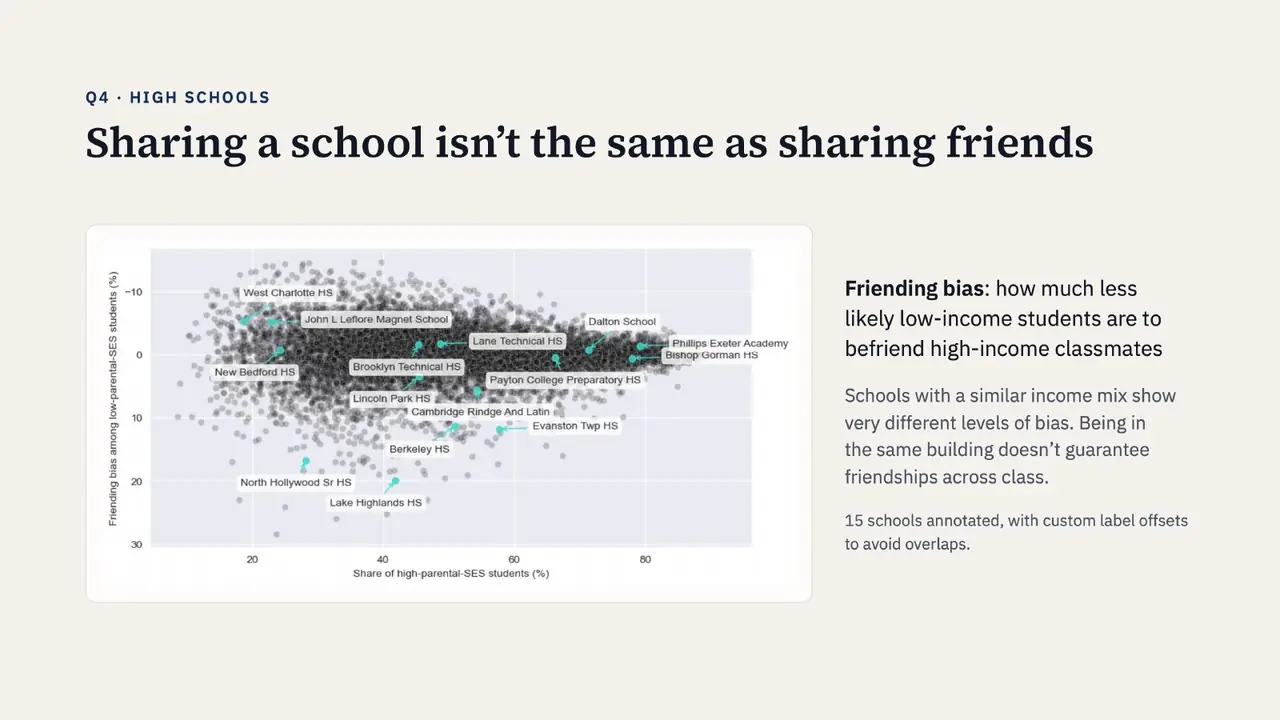
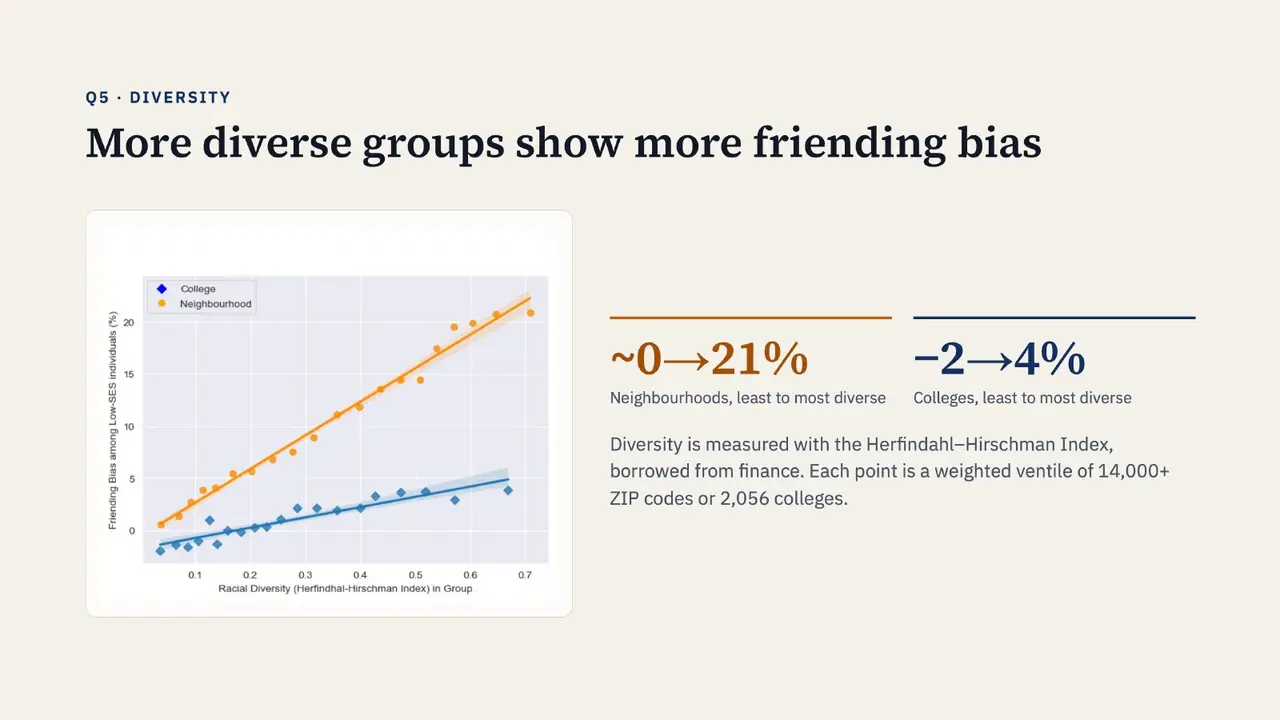
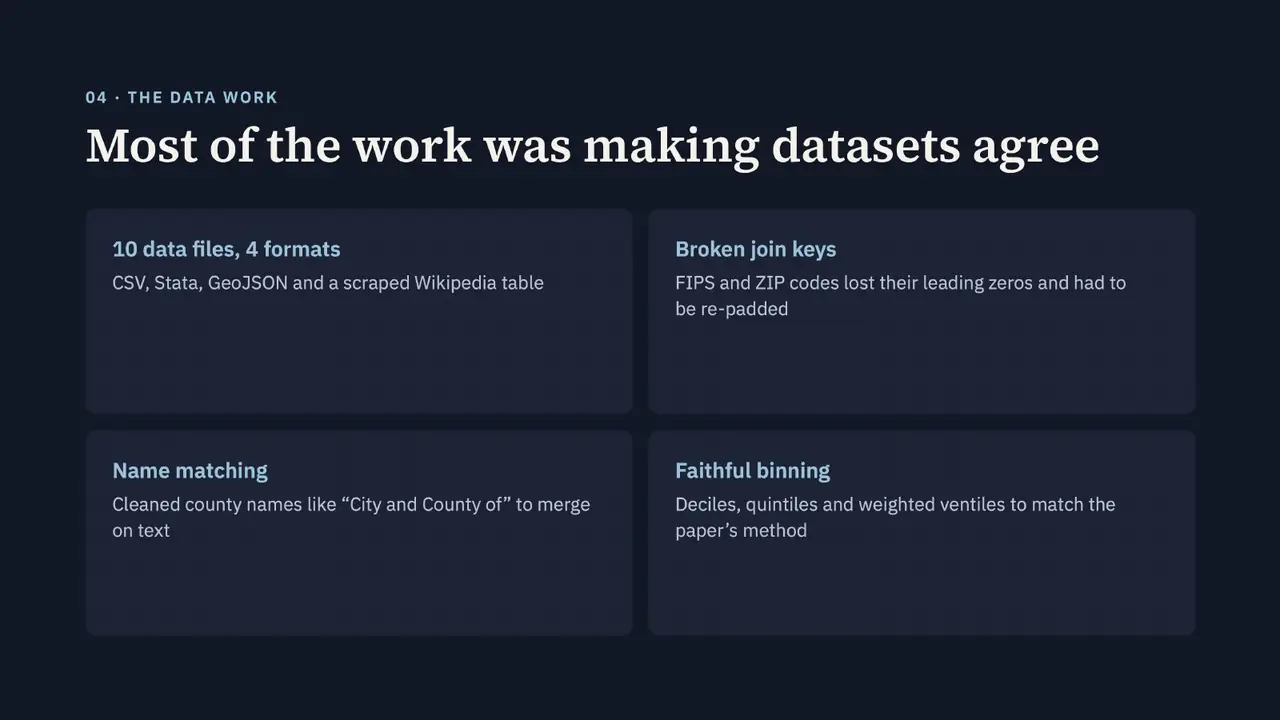
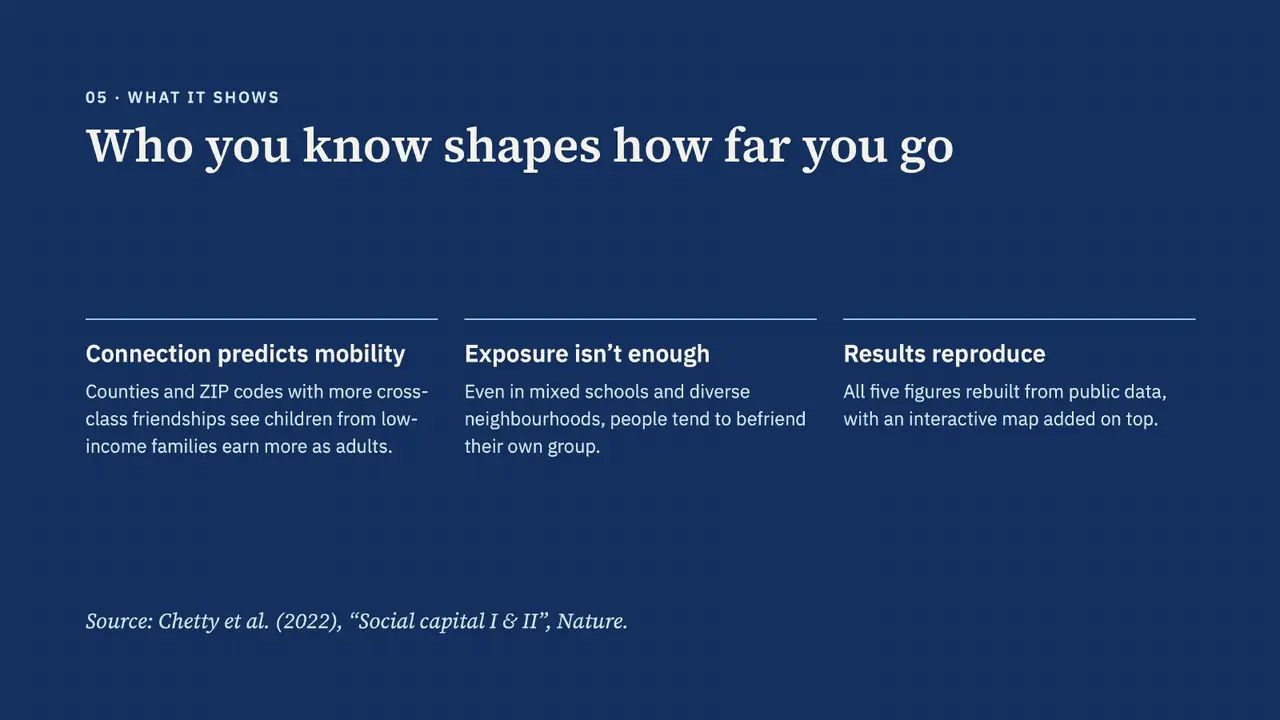
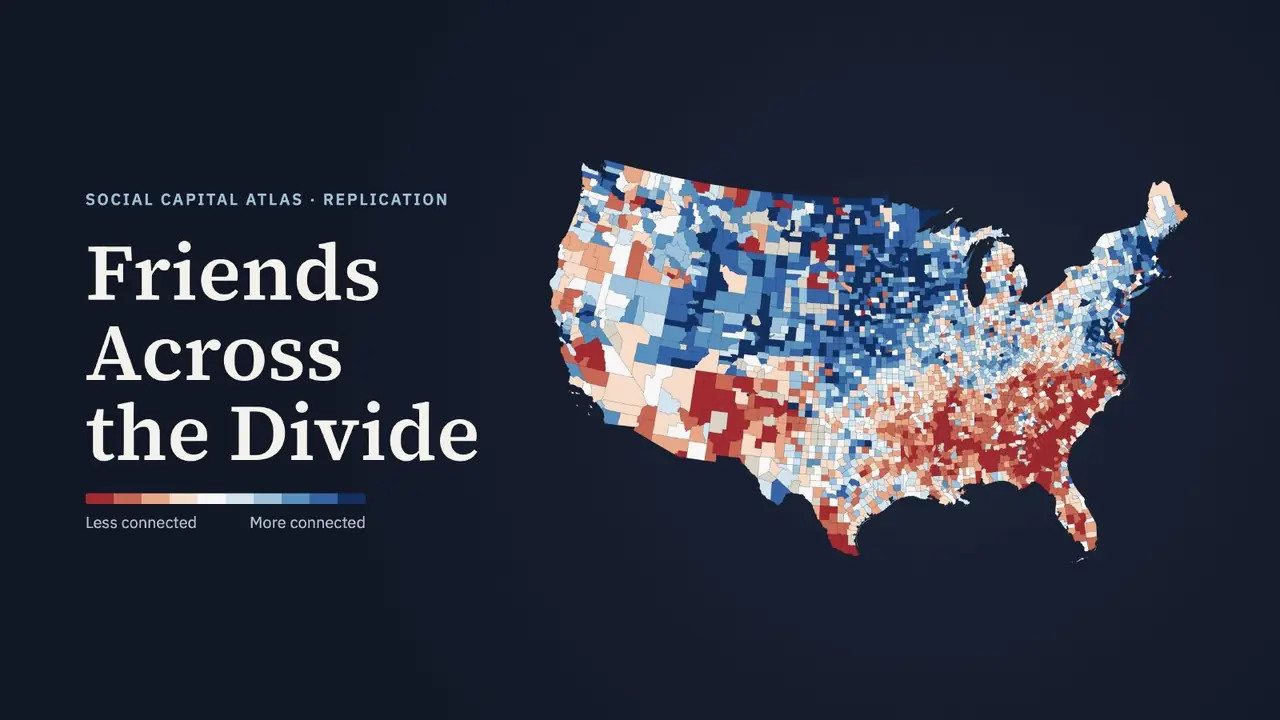
I rebuilt the figures in Python: an interactive Plotly map of economic connectedness across US counties, connectedness versus mobility in the 200 largest counties, binned scatters by ZIP code, and friending bias in high schools and by racial diversity. Most of the work was making ten data files in four formats agree: re-padding FIPS and ZIP codes that lost their leading zeros, matching county names, and binning with deciles and weighted ventiles to match the paper's method.